Everything your agency needs, none of it a dashboard.

One partner, six ways to stay ahead of the questions — from the weekly pulse check to the report that goes in front of council.

1

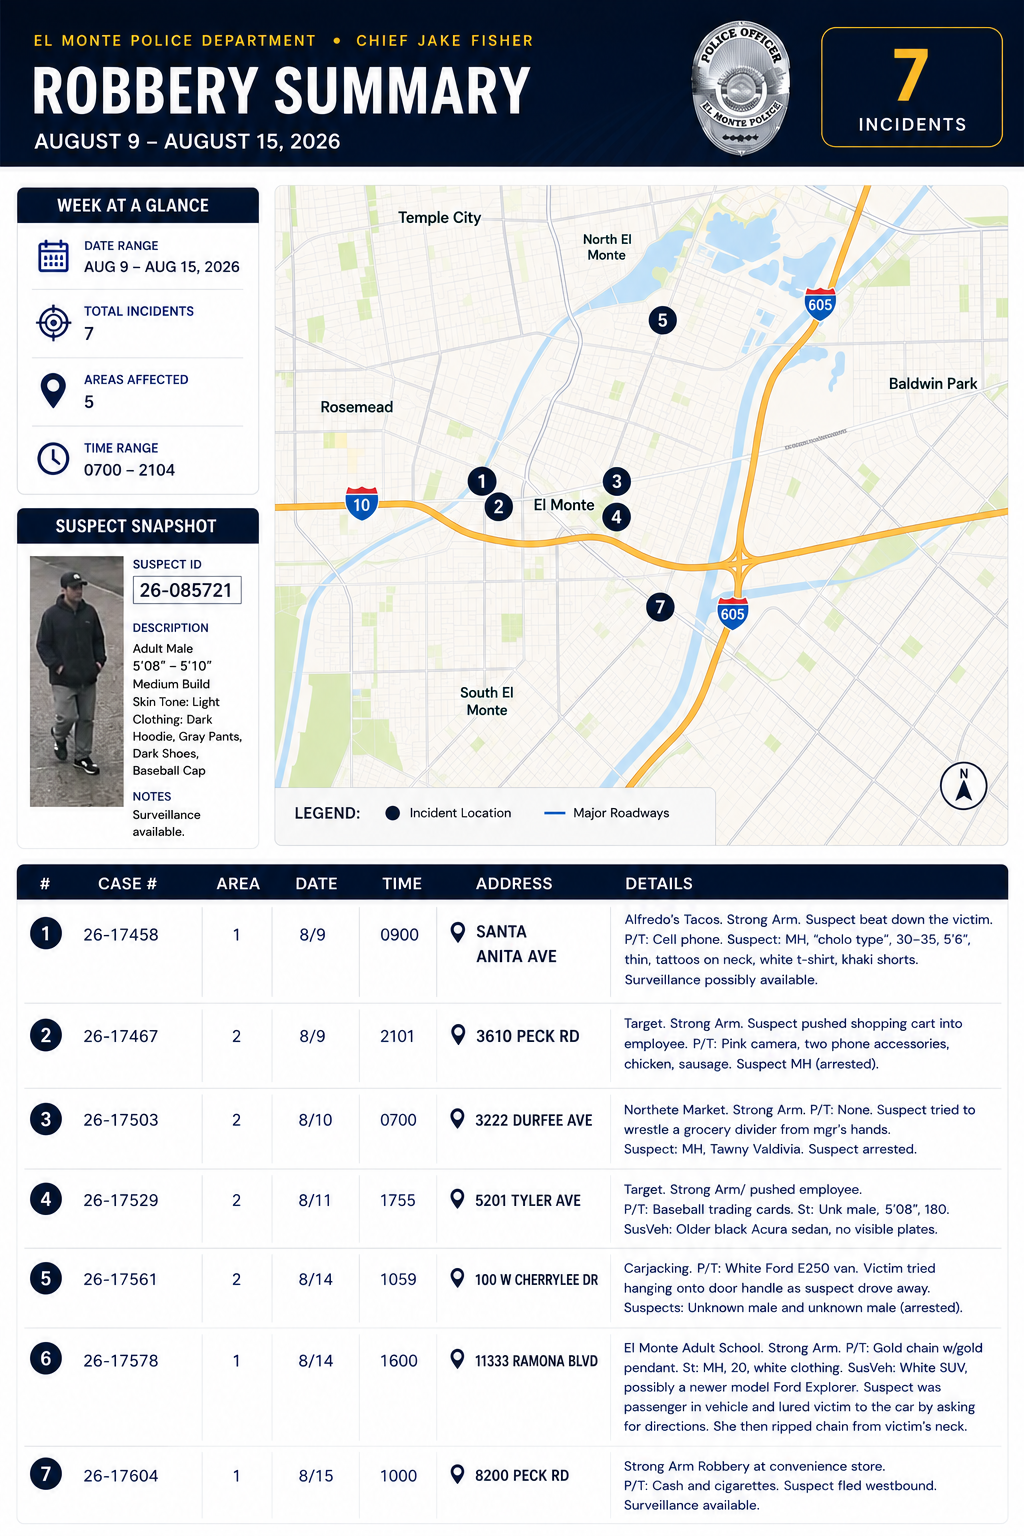
Weekly Summaries

52 per year. A visual recap of the week's preventable crime — beyond the watch log or briefing board — so every officer knows what to look for on their beat, whether or not they were working when it happened.

Downloadable one-sheet — coming soon
2

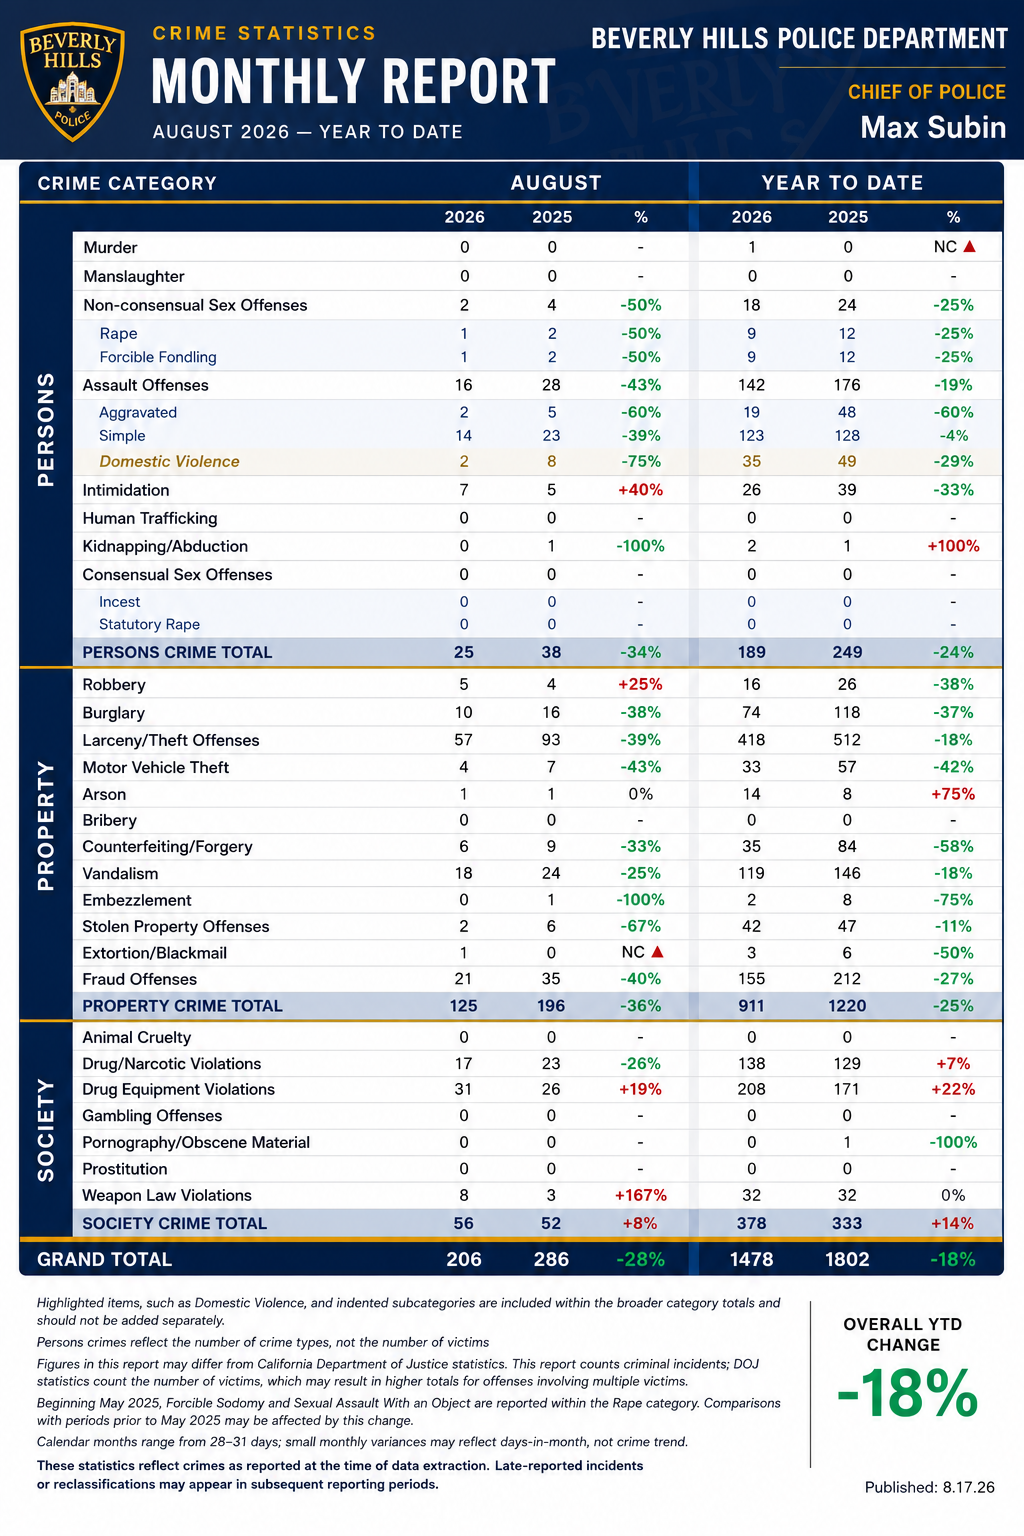
Monthly NIBRS Crime Reports

12 per year. An analyst — not a dashboard — reads the month's crime picture and writes the summary, with a full NIBRS code compliance review built in. Presentation-ready.

Downloadable one-sheet — coming soon
3

30/60-Day Comparisons

Fast, clear reads on what's changed and why — for the moments that call for a comparison, not a full report cycle.

Downloadable one-sheet — coming soon
4

Mid-Year & Annual Reports

Built for the council or community meeting. Pulls the whole period together — calls for service, officer-initiated activity, arrests, workload, response times where your system captures them, and geographic patterns — with the trend already drawn out for you.

Downloadable one-sheet — coming soon
5

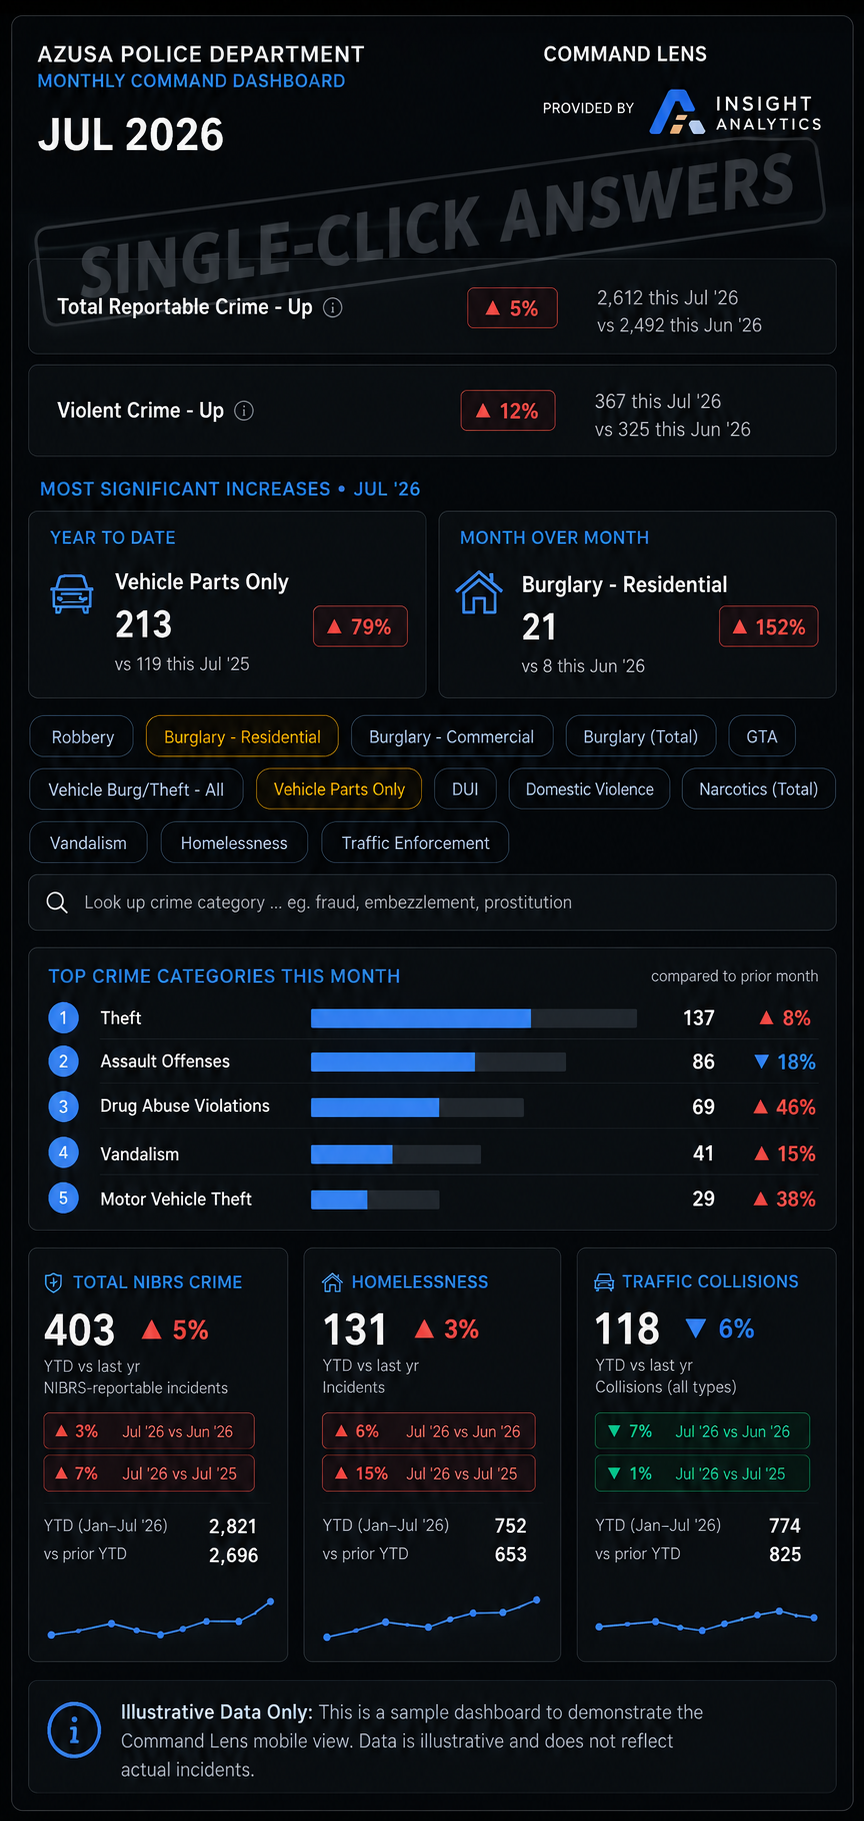
Command Lens

Your agency's stats, published reports, and key information — in the chief's hand, anytime. See the full feature →

Downloadable one-sheet — coming soon
6

Mobile Forensics Add-On

Certified phone experts handle call detail records, tower dumps, and investigative analysis. On the administrative side, the same team covers beat reallocation, workload analysis, public records requests, and legal data review — some included in your agreement, the rest scoped as it comes up.

Downloadable one-sheet — coming soon

The kind of view a deliverable gives you

Illustrative excerpts, not actual client reports — the real deliverables run deeper.

Monthly Summary — Illustrative Persons Crime Property Crime Society Crime ▼ 14% ▼ 8% ▲ 5% Category totals, month over month, with year-to-date context.
Monthly crime statistics — sample layout
Overtime Analysis — Illustrative +14% Year-over-year change Budget vs. actual, tracked to the pay period.
Overtime analysis — sample layout

Not sure which of these fits your agency?

Talk to a Crime Analyst